Accident Year vs Calendar Year: Which View Should You Use for Claims Analytics?
Most small carriers default to calendar year for everything. That's fine for financial reporting — but it can mislead you on loss trends.
If you work at a large carrier with a dedicated actuarial team, this distinction is second nature. But for the small to mid-sized carriers, MGAs, and MGUs we work with, the difference between accident year and calendar year claims views is often a source of confusion — and sometimes a source of bad decisions.
Let's break it down plainly.
Calendar Year: What Happened This Year
A calendar year (CY) view of claims shows all financial transactions that occurred during the calendar year, regardless of when the underlying loss happened. If a claim from a 2021 accident has a reserve increase in 2025, that reserve change shows up in the 2025 calendar year.
This is the view your financial statements use. It matches how accounting works: all dollars in, all dollars out, for the reporting period. It's the right view for:
- Statutory financial reporting
- Cash flow analysis
- Investment income planning
- Answering the question: “How much did we pay in claims this year?”
Accident Year: What's Happening to the Business We Wrote
An accident year (AY) view groups claims by the year the loss occurred (or was reported, depending on your convention), regardless of when the payments and reserve changes happen. A claim from a 2021 accident with a 2025 reserve increase still sits in accident year 2021.
This is the view that tells you whether your underwriting is producing acceptable results. It answers fundamentally different questions:
- Is the business we wrote in 2024 developing better or worse than 2023?
- Are our loss ratio trends improving or deteriorating by vintage?
- Which accident years are still developing, and by how much?
- Are our current pricing decisions adequate for the risks we're accepting?
Why Calendar Year Alone Can Mislead You
Here's a scenario we've seen play out at multiple carriers:
A carrier's 2025 calendar year loss ratio looks excellent — 55%, well below their target of 62%. The underwriting team celebrates. But the accident year view tells a different story: the 2025 accident year is developing at 68% at the same maturity point where the 2024 accident year was at 58%. The current-year business is actually underperforming.
Why does the calendar year look good? Because favorable development on older accident years (reserve releases on 2021 and 2022 claims that closed for less than reserved) is offsetting the deterioration in the current year. The calendar year mixes old good news with new bad news and produces a number that looks fine.
The danger: if the carrier uses the CY loss ratio to validate their current pricing, they'll under-price for another year, and the AY deterioration will compound. By the time the older accident years are fully developed and the favorable development stops flowing through, the current-year problem will be deeply embedded in the book.
When to Use Each View
Use Calendar Year when:
- Preparing financial statements and statutory filings
- Analyzing cash flow and payment patterns
- Reporting to the board on “what happened this year financially”
- Evaluating overall claims department expense ratios
Use Accident Year when:
- Evaluating underwriting quality and pricing adequacy
- Comparing loss ratios across vintages (is 2025 better than 2024?)
- Setting or adjusting rate levels by LOB
- Identifying emerging severity or frequency trends
- Conducting loss development analysis (triangles)
- Assessing individual underwriter performance over time
The Loss Development Dimension
Accident year analysis becomes particularly powerful when combined with loss development tracking. A loss development triangle shows how each accident year's losses evolve over time. For long-tail lines like Workers Comp or Professional Liability, an accident year might develop for 5-7 years before reaching ultimate.
By comparing the development pattern of the current accident year against prior accident years at the same maturity point, you can estimate whether the current year is tracking favorably or unfavorably. This is the foundation of pricing adequacy analysis, and it's only possible in an accident year framework.
In calendar year, development is invisible. A $500K reserve increase on a 2022 Workers Comp claim just shows up as a 2025 expense. You see the dollar impact but not the story: the 2022 accident year is developing adversely, which may indicate that the pricing and underwriting decisions made in 2022 were inadequate.
The Practical Challenge: Having Both
The reason most small carriers default to calendar year is simple: their systems make it easy. Every policy admin system and claims system produces calendar year reports because that's what the financial statements require. Accident year views require reclassifying every transaction by the date of loss — which means building a separate analytical layer.
That separate layer is exactly what an analytics platform provides. When claims data is loaded into a structured data warehouse, each claim carries both its transaction date (for CY) and its accident date (for AY). The same data supports both views — the user simply toggles between them.
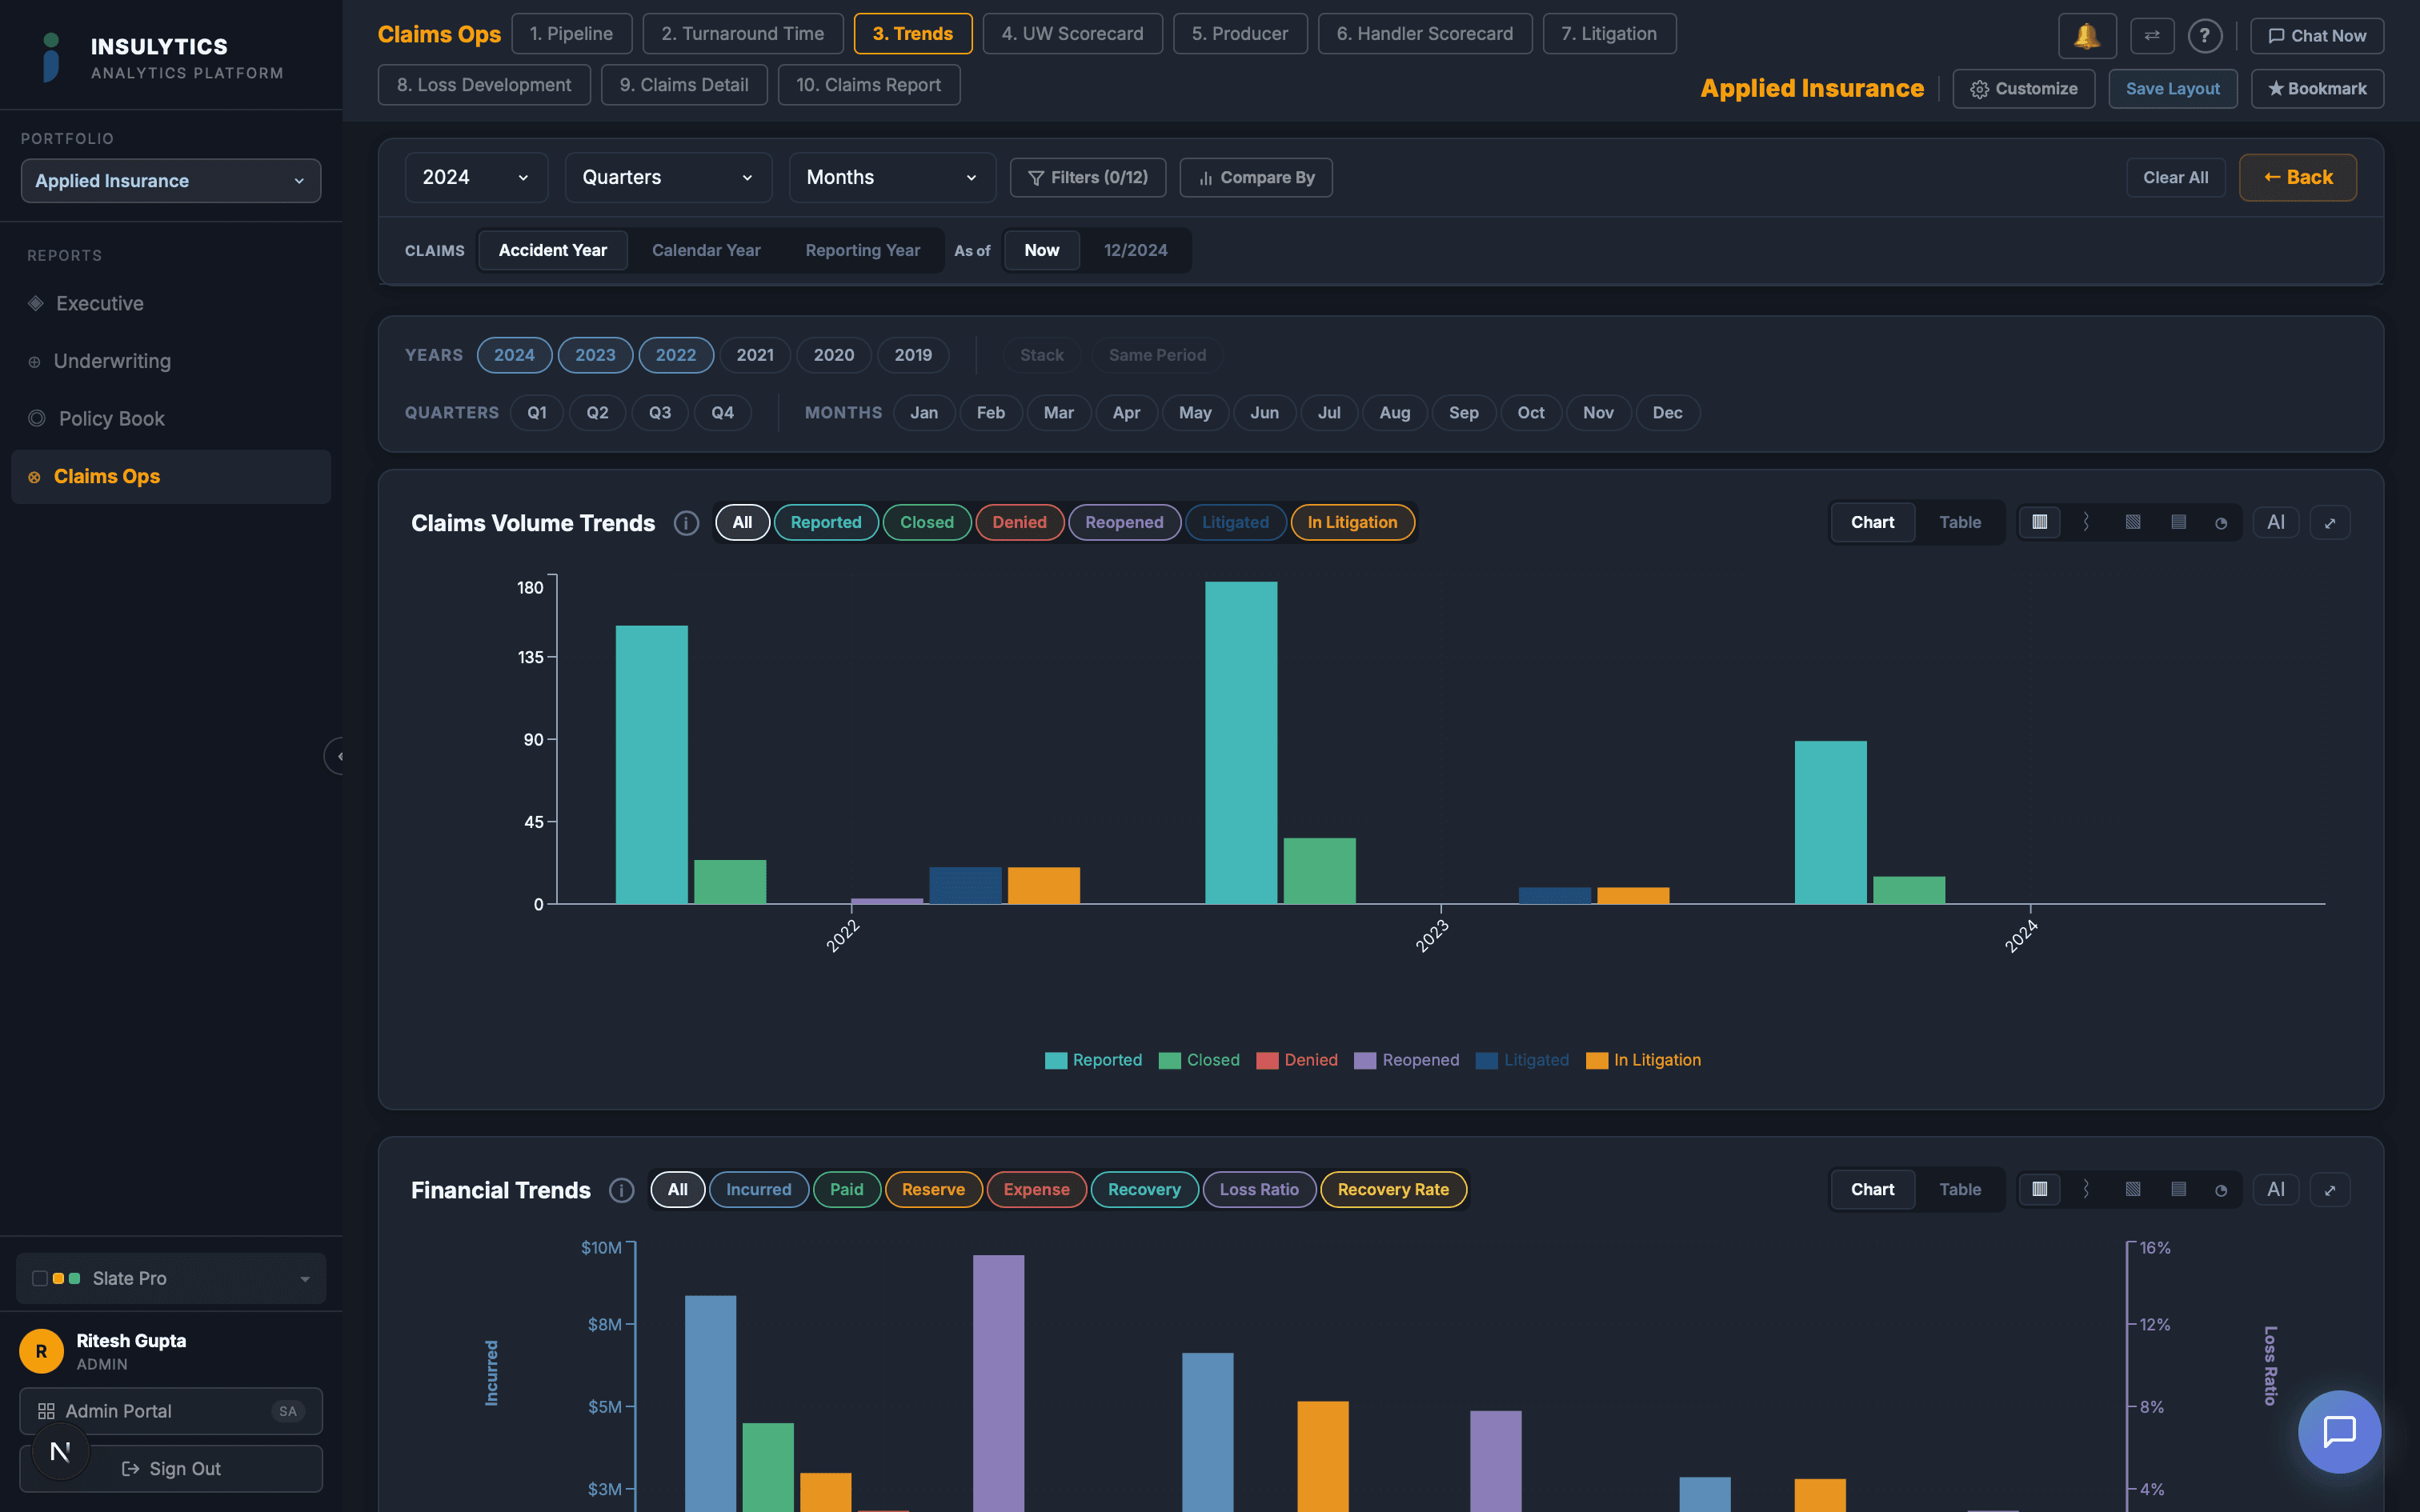
This is how we've built the claims analytics in Insulytics: every claims dashboard supports both CY and AY views as a date basis toggle. The user can switch between them with a single click and see how the same underlying data tells different stories depending on the analytical lens.
The Bottom Line
Calendar year tells you what happened to your bank account. Accident year tells you what's happening to your book. You need both — but if you're only looking at one, and it's calendar year, you're flying with an outdated instrument panel.
The carriers that catch loss ratio deterioration early are the ones looking at accident year trends weekly, not the ones who discover the problem in the annual actuarial review.