Why Your Hit Ratio Is Dropping — And Where to Look First
A declining hit ratio is a symptom, not a diagnosis. The real question is where in your pipeline submissions are falling off — and why.
A hit ratio decline is one of the most common problems in commercial insurance — and one of the most misdiagnosed. When the number drops, the instinct is to blame pricing (“we're too expensive”), competition (“the market is soft”), or broker behavior (“they're shopping us”). Those may all be true, but they're not actionable without knowing where in the pipeline submissions are falling off.
In our experience working with MGAs, carriers, and MGUs, a hit ratio decline almost always has a specific, identifiable bottleneck. Finding it requires looking at the submission pipeline as a series of conversion stages — not a single input-to-output ratio.
The Pipeline Isn't One Number — It's Five
A typical commercial insurance submission moves through five stages: received, cleared, rated/quoted, quote accepted, and bound. The hit ratio — bound divided by received — compresses all five stages into one metric. That compression hides everything useful.
Consider two scenarios that both produce a 15% hit ratio:
- Scenario A: 100 submissions received → 90 cleared → 70 quoted → 25 accepted → 15 bound. The bottleneck is between quote and acceptance. Your pricing might be off, your terms might be uncompetitive, or your turnaround on quote modifications is too slow.
- Scenario B:100 submissions received → 40 cleared → 38 quoted → 20 accepted → 15 bound. The bottleneck is clearance. You're declining or auto-declining 60% of submissions before they ever see an underwriter. Your appetite guidelines may be too narrow, your auto-decline rules too aggressive, or your producers are sending you business outside your sweet spot.
Same hit ratio. Completely different root causes. Completely different fixes.
Stage 1: The Clearance Bottleneck
Clearance is the first and often largest source of leakage. In a well-run operation, clearance should take less than 2 business days and should decline no more than 15-20% of submissions (depending on appetite breadth). If your clearance rate is below 70% or your clearance time exceeds 3 days, start here.
Common causes of clearance bottlenecks:
- Staffing misalignment:We've seen organizations where one clearance analyst handles all incoming submissions regardless of volume. On high-volume days (typically Mondays and Tuesdays after weekend broker activity), submissions pile up and age out before they're even reviewed.
- Auto-decline rules that are too broad:If your system auto-declines submissions based on class code alone without considering premium size, account history, or producer relationship, you're likely rejecting profitable business that a human underwriter would have approved.
- Producer mismatch:If 40% of your submissions are in classes or territories you don't write, you don't have an underwriting problem — you have a distribution problem. Your producers don't understand your appetite, or they're using you as a last resort after their preferred markets pass.
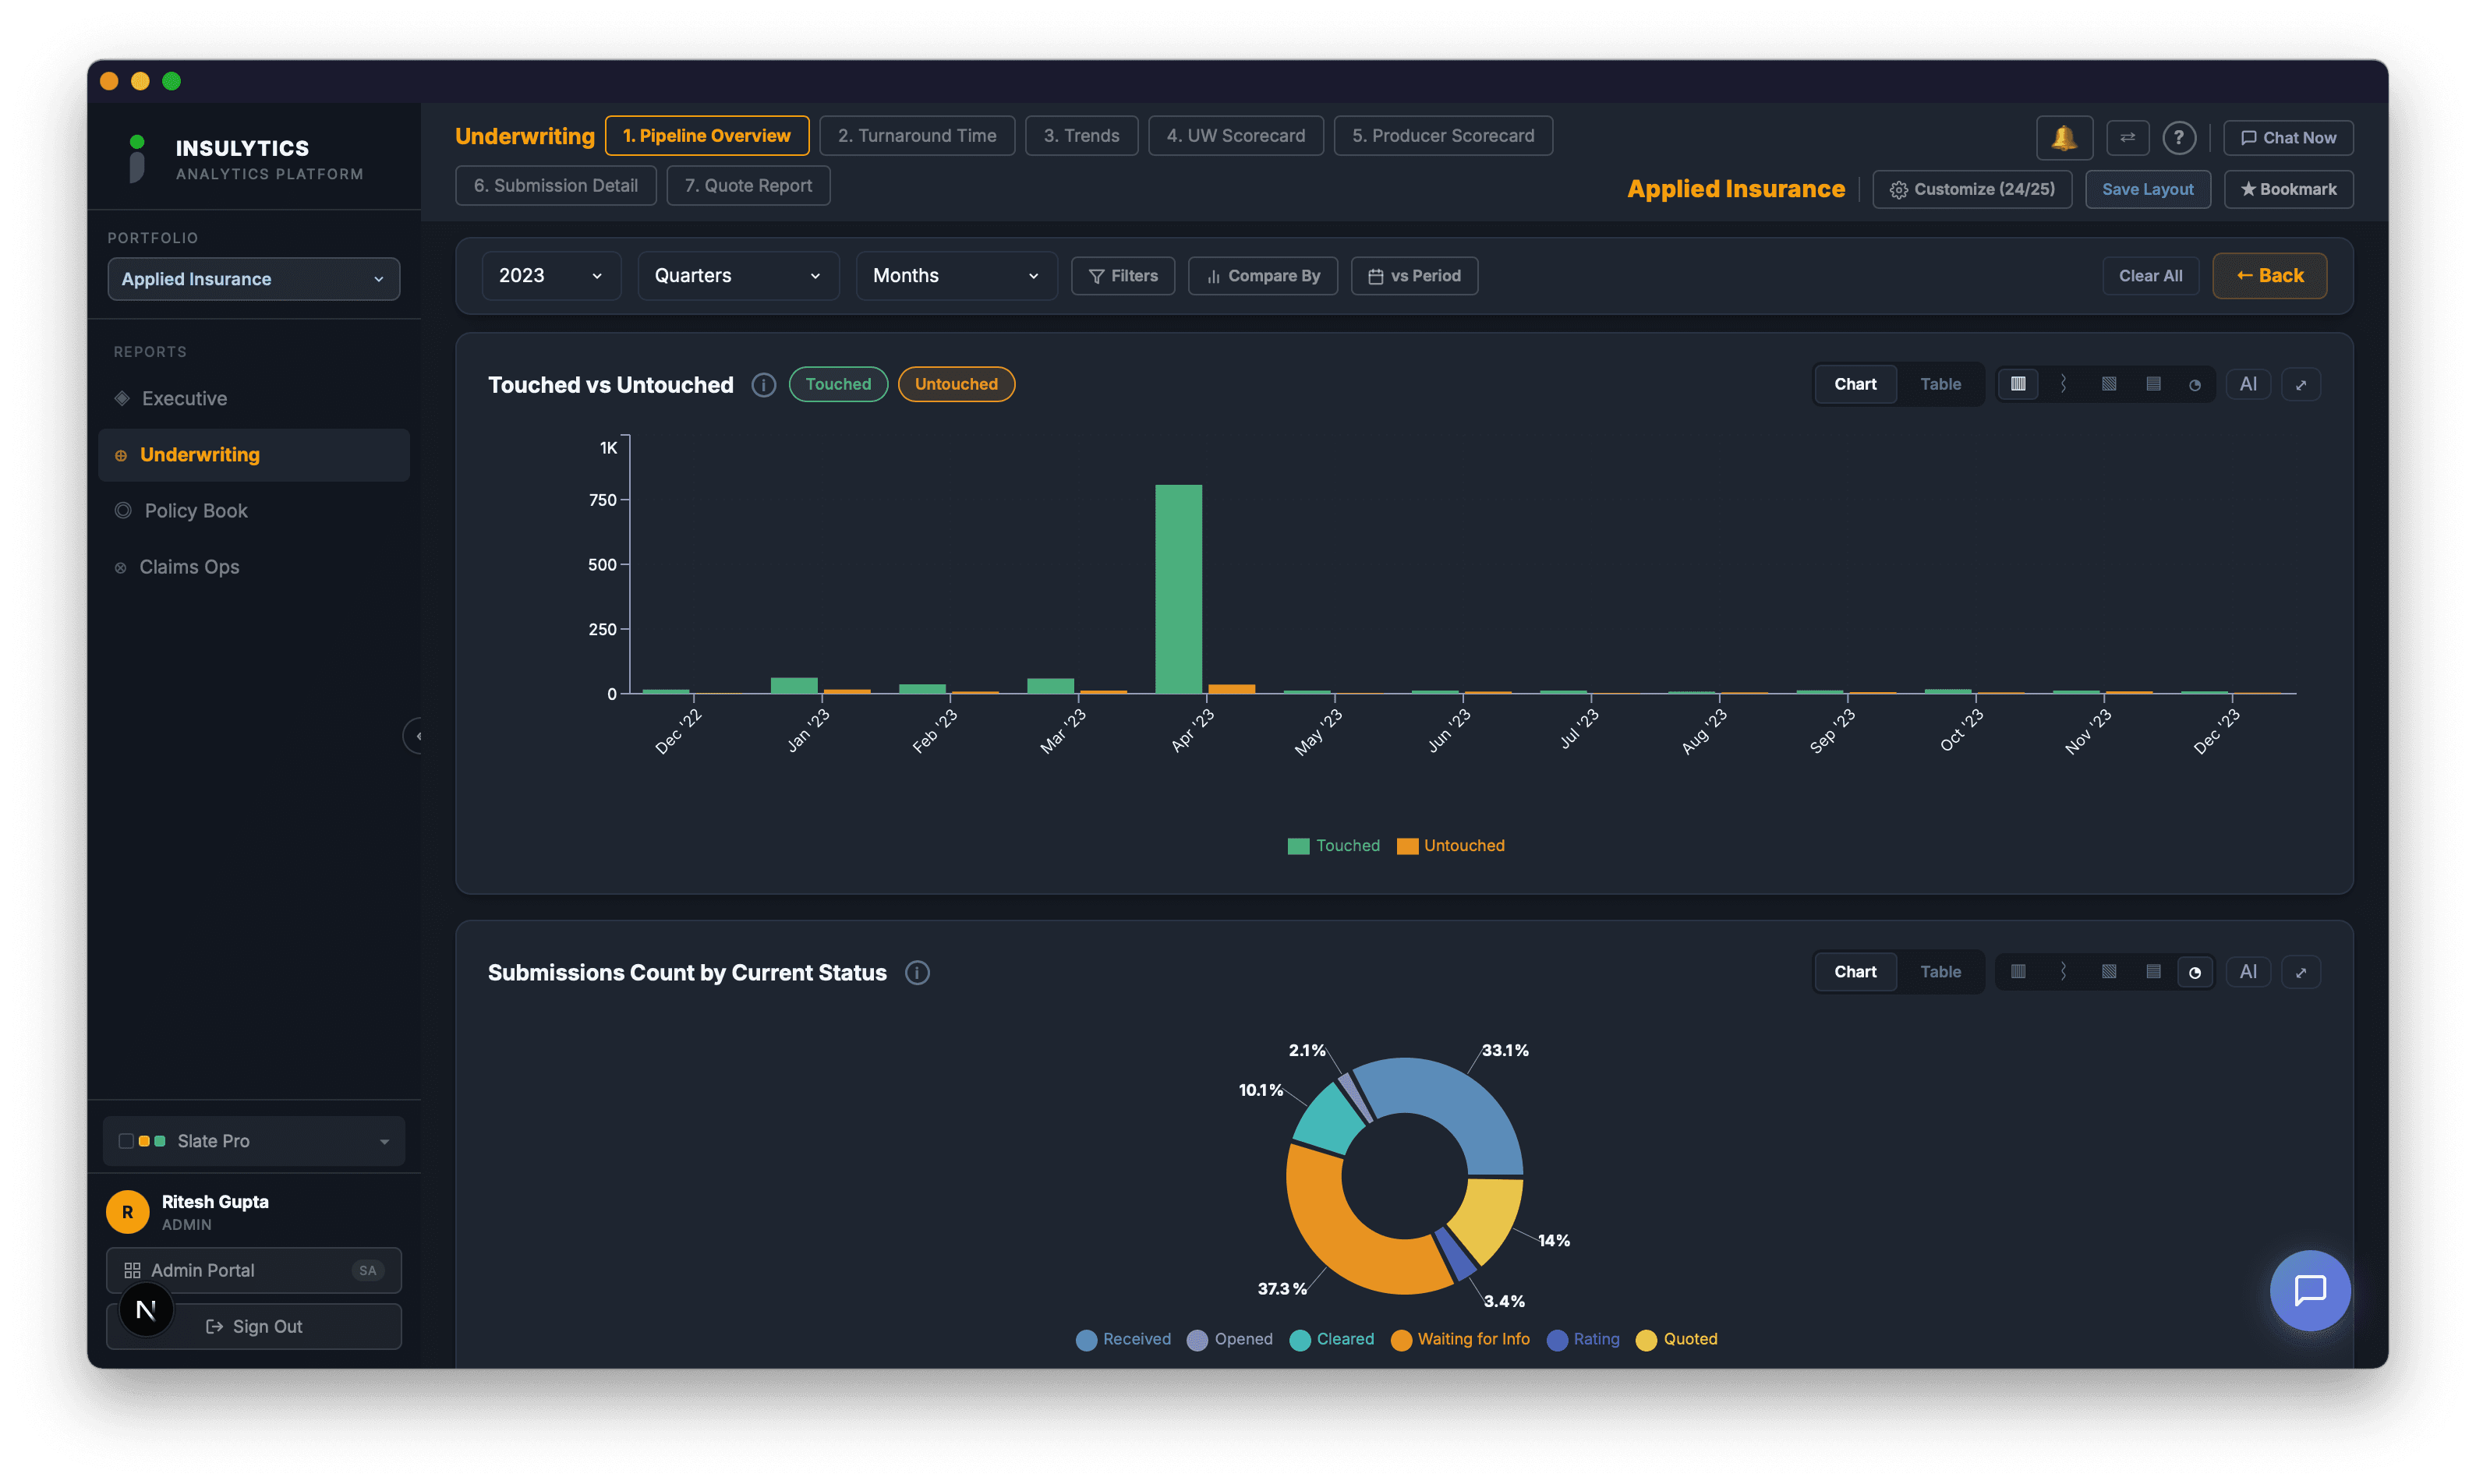
Stage 2: The Quoting Gap
Once a submission clears, it needs to get quoted. The clearance-to-quote cycle time is the metric that tells you whether your underwriting team is keeping up with demand. If the average is over 5 business days, you're losing deals to faster competitors — even if your pricing is competitive.
Brokers operate on their own timelines. They need a quote by their client's renewal date, and they're typically working with 2-3 markets simultaneously. If your quote arrives 4 days after a competitor's, the broker has often already made a recommendation to the insured. Your quote becomes a negotiation tool, not a real contender.
Break the clearance-to-quote time down by underwriter. In almost every organization we've analyzed, the average is skewed by 1-2 underwriters who are either overloaded, handling complex specialty risks that inherently take longer, or working inefficient processes (manual rate calculations, class code lookups that require external research, or waiting on loss runs that the producer hasn't sent).
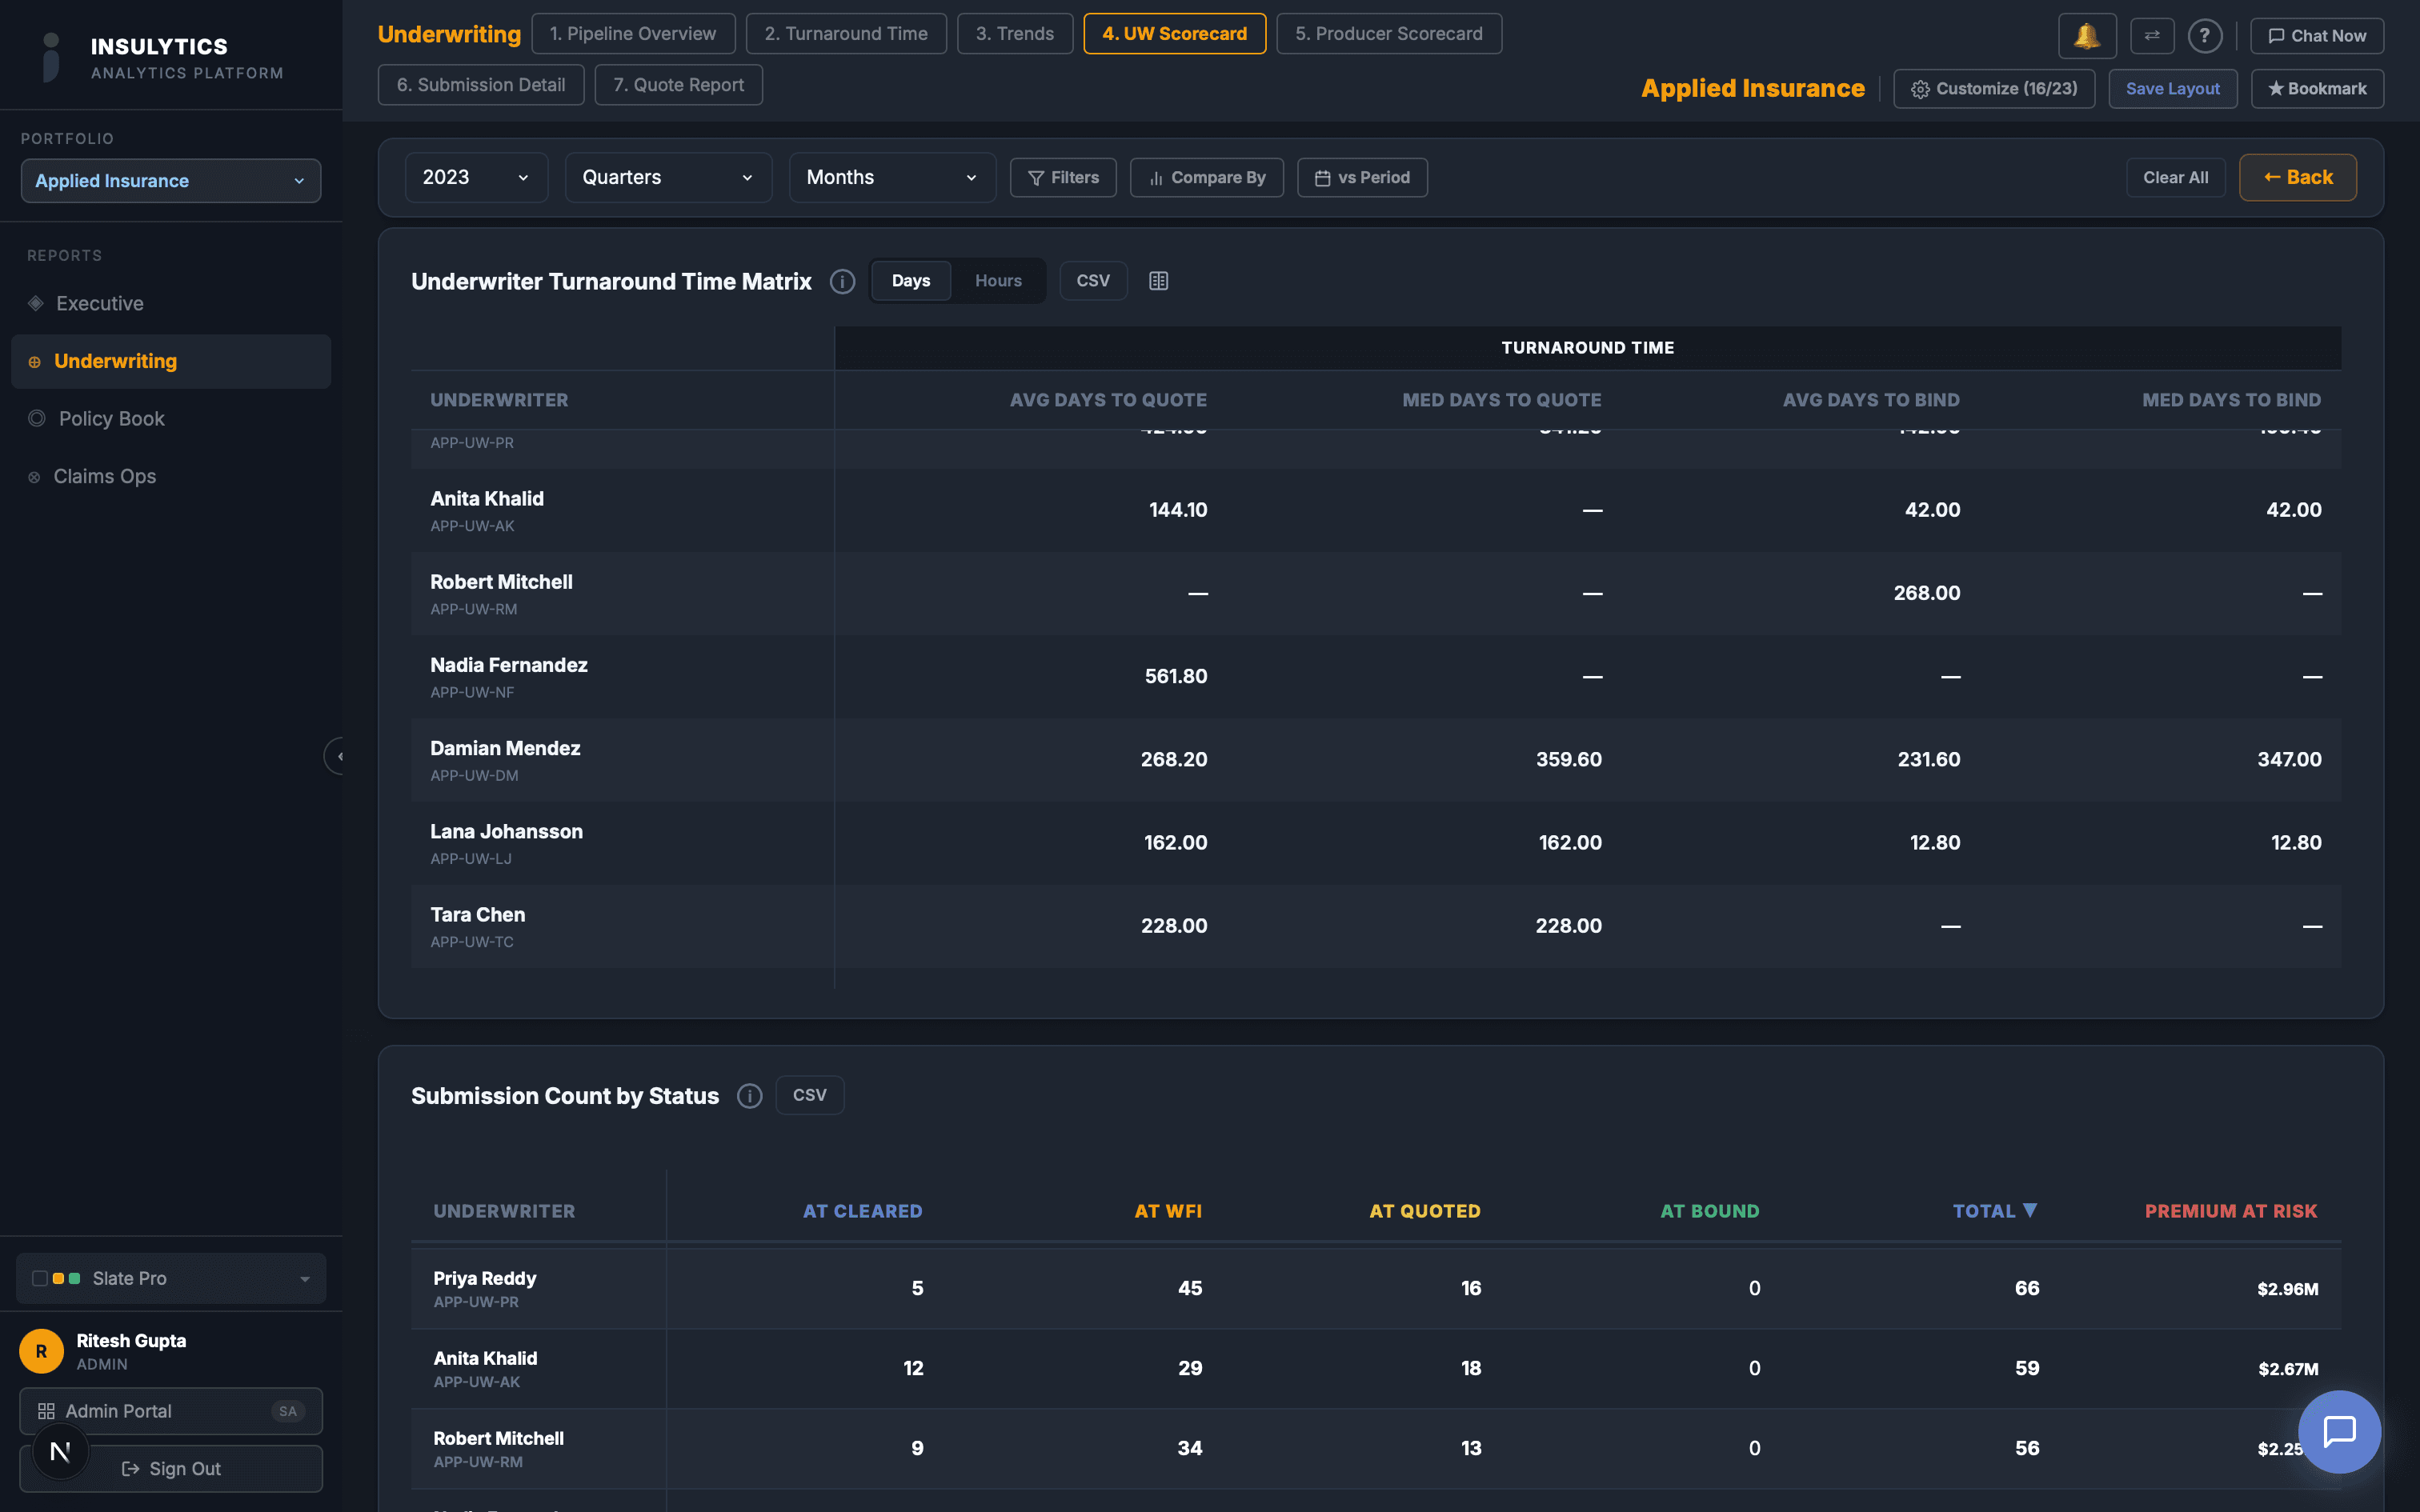
Stage 3: The Quote-to-Bind Drop
If submissions are clearing quickly and getting quoted promptly, but the quote-to-bind conversion is declining, the issue is downstream. This is where pricing, terms, and broker relationship dynamics come into play.
Before assuming you're overpriced, check a few things:
- Quote-not-taken reasons:If your system captures QNT reason codes, analyze them by LOB and producer. “Price” is the most common reason given, but it's often a catch-all. The real reasons may be terms, exclusions, deductible structures, or simply that the broker found a more flexible carrier.
- Quote revision count: How many times does the average quote get revised before it either binds or falls off? A high revision count (3+) suggests that initial quotes are consistently missing the mark. Either your rating engine needs calibration or your underwriters need better data on competitive pricing.
- Producer-level conversion:If your quote-to-bind rate is 50% with Producer A and 12% with Producer B, the issue isn't your pricing — it's Producer B's shopping behavior. Some producers submit to 5 markets for every deal; others submit to their preferred market first and only shop if declined. Knowing which producers actually convert tells you where to invest your underwriting time.
Stage 4: The Expiration Problem
There's a stage that doesn't show up in the traditional hit ratio calculation: submissions that expire without any action. These aren't declined, quoted, or bound. They simply age past their effective date and become moot.
At one MGA we worked with, 30% of all submissions expired before a quote was issued. The VP of Underwriting was shocked — he assumed every submission got a response. The data showed that submissions received within 15 days of the effective date had a 70% expiration rate. The submissions were arriving too late to process, but nobody was tracking the gap between received date and effective date to flag them.
This is a solvable problem: flag submissions where the effective date is less than 10 days from receipt, fast-track them to the front of the clearance queue, and set up an alert when the stalled count in this category exceeds a threshold. But you can't solve it if you can't see it.
The Diagnostic Framework
When your hit ratio drops, work backwards through the pipeline:
- Check quote-to-bind first.If this stage is stable, the problem is upstream. If it's declining, investigate pricing, terms, and producer mix.
- Check clearance-to-quote time.If it's increasing, you have a capacity or process bottleneck in underwriting. Break it down by underwriter to find the source.
- Check clearance rate. If more submissions are getting declined at clearance, investigate whether appetite has narrowed or producer submission quality has changed.
- Check the expiration rate. If submissions are timing out, the issue is either late-arriving submissions, slow clearance, or both.
- Compare by producer.At every stage, segment by producer. The overall trend is almost always driven by a small number of producers or a specific LOB. Find the outlier and you've found the problem.
The hit ratio is the metric everyone reports. But the five stage-level metrics underneath it are what actually drive improvement. If your analytics platform only shows you the aggregate, you're managing by headline — and the headline never tells the full story.